Division of Biology and Medicine
Center for Alternatives to Animals in Testing
Image Visualization
Investigators in the Center for Alternatives to Animals in Testing are developing new and exciting ways to visualize and explore 3D images of microtissues.
Image Visualization
Investigators in the Center for Alternatives to Animals in Testing are developing new and exciting ways to visualize and explore 3D images of microtissues.
Visualization and Computational Analysis of 3D microtissues
- In collaboration with the Center for Computation and Visualization (CCV), investigators in the Center are developing new and exciting ways to visualize and computationally analyze 3D images of microtissues.
- The first step is the acquisition of a z-stack of about 50 images of a single microtissue using the Center’s Opera Phenix high throughput confocal microscope. This automated microscope is able to image and generate individual z-stacks of images for over 384 microtissues in about an hour.
- Images are then computationally rendered into a 3D dataset for each microtissue that reveals the 3D structure of each microtissue.
- The images are further analyzed to reveal quantitative information about the structure and function of 3D microtissues.
- For example, the Morgan lab is using their ovary microtissues to investigate the sensitivity of intercellular gap junction communication to drugs and environmental toxicants. When gap junctions are open, fluorescent reporter molecules freely pass between cells and into the center of the microtissue. When treated with drugs or toxicants, gap junctions close and confocal 3D images can detect this change in live ovary microtissues.
- To quantify these changes in gap junction communication, we have developed a completely automated segmentation process to analyze the fluorescent images of the lower hemisphere of the ovary microtissues.
- The computational processing first identifies the outer surface of each microtissue. It next finds the equator of each microtissue, removes the upper hemisphere where signal is low and further processes the southern hemisphere by segmenting it into concentric 10 micron shells (~ diameter of a single cell) that proceed to the core of each microtissue.
- The quantitation of fluorescence in each shell reveals how easily fluorescent reporter molecules can diffuse between cells via gap junctions and to what extent gap junctions have been closed due to drug or toxicant treatment.
 Play
Play
1
of
3
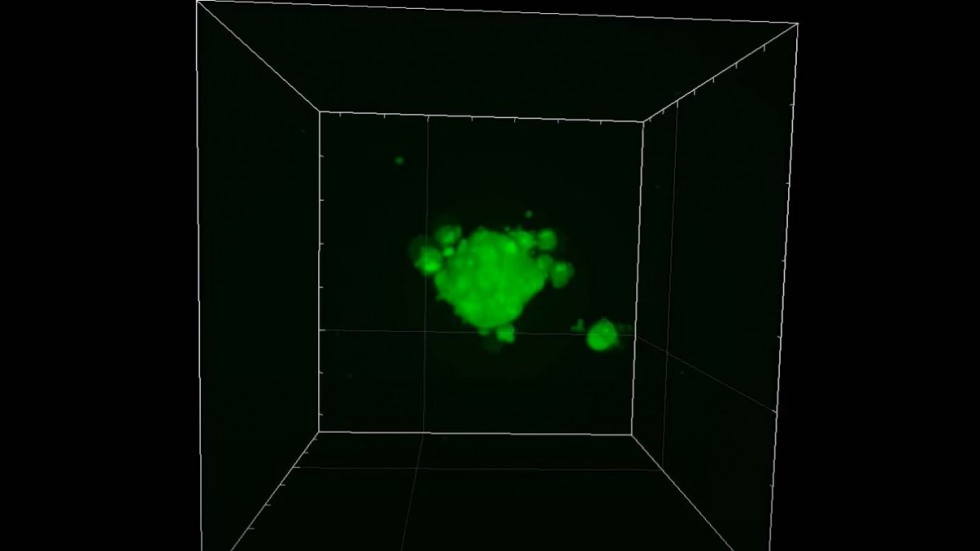
Three dimensional confocal images of living ovary microtissues (small and large) stained with a fluorescent dye showing the depth of imaging of live microtissues.
2
of
3
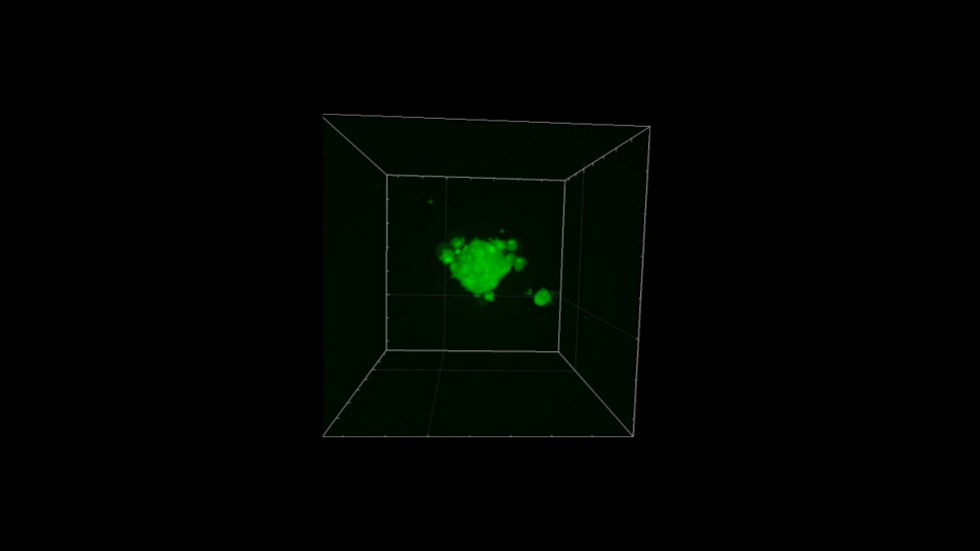
Three dimensional confocal image of small living ovary microtissues.
3
of
3